Charco de La Laja
See how the volcanic shore shapes the bathing area. Check local notices, tides and swell before entering the water.
View on map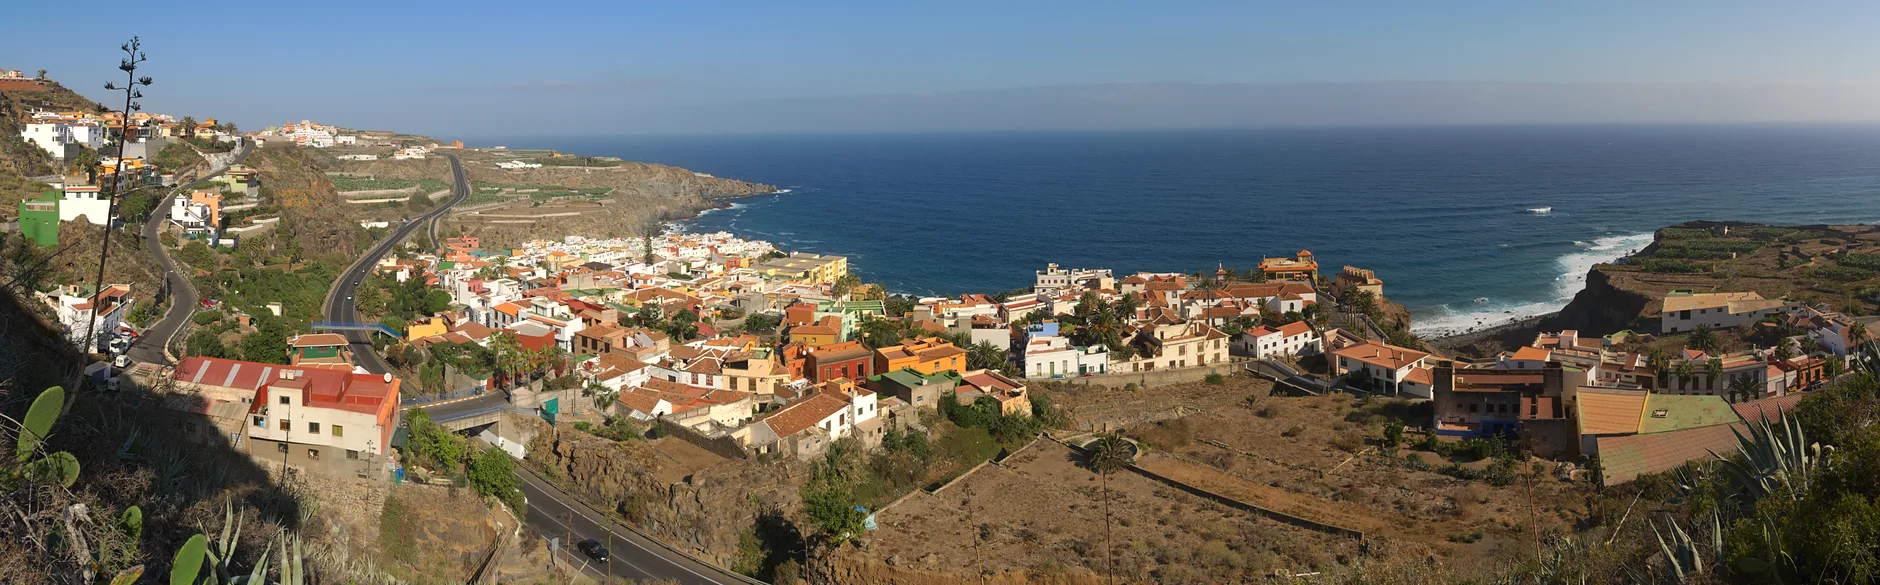
San Juan de la Rambla
Plan a visit to San Juan de la Rambla. Discover landscapes, neighbourhoods and places of interest in the guide and check access before you go. Start with Charco de La Laja and San José.
See how the volcanic shore shapes the bathing area. Check local notices, tides and swell before entering the water.
View on mapExplore the streets and squares on foot and pause to look at the traditional buildings.
View on mapPlan the visit in two stops and allow time to travel between them. Check official information before walking, entering a protected area or swimming.
PVGIS typical meteorological year (2005–2020) at the reference point. Sunshine uses hourly direct irradiance of at least 120 W/m²; daylight is calculated from latitude. Both are average hours per day. Conditions vary between the coast, uplands and mountains.
San Juan de la Rambla · 28.3796, -16.6453 · 412 m
| Month | Mean temperature (°C) | Sunshine (h) | Daylight (h) |
|---|---|---|---|
| Jan | 9.8 | 6.7 | 10.6 |
| Feb | 7.7 | 5.4 | 11.2 |
| Mar | 10.2 | 6.4 | 11.9 |
| Apr | 10.5 | 4.1 | 12.8 |
| May | 15.1 | 8.3 | 13.6 |
| Jun | 17.2 | 5.7 | 13.9 |
| Jul | 19.0 | 9.5 | 13.7 |
| Aug | 19.9 | 7.5 | 13.1 |
| Sep | 18.9 | 7.2 | 12.3 |
| Oct | 16.4 | 5.8 | 11.4 |
| Nov | 13.5 | 5.5 | 10.7 |
| Dec | 10.6 | 6.7 | 10.4 |