Los Roques de Fasnia
Allow time for a walk along the coast. If you plan to swim, check the sea conditions and follow local signs.
View on map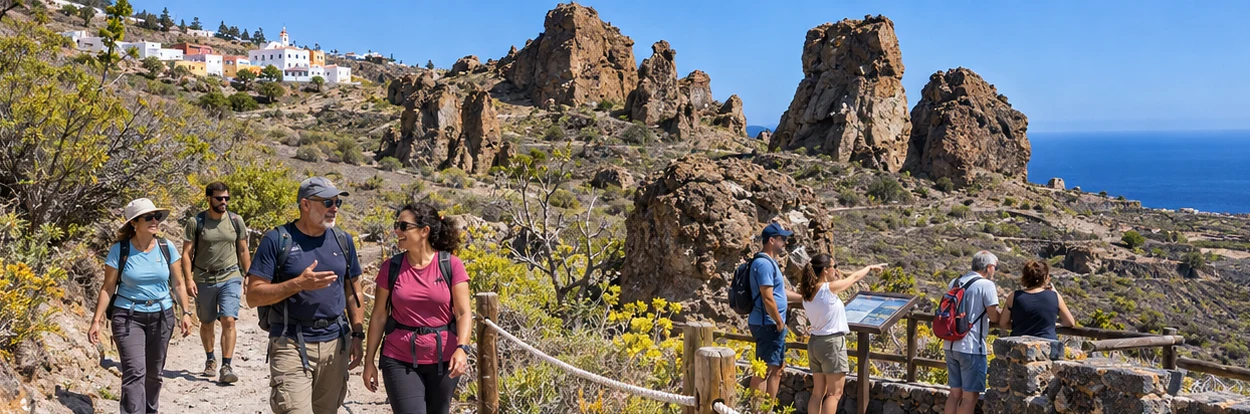
Fasnia
Explore Fasnia one municipality at a time. Find places to visit, local businesses and ideas for your trip or everyday life. Start with Los Roques de Fasnia and Iglesia de San Joaquín.
Allow time for a walk along the coast. If you plan to swim, check the sea conditions and follow local signs.
View on mapLook closely at the historic site and its setting. Check access and visitor arrangements before going inside.
View on mapPlan the visit in two stops and allow time to travel between them. Check official information before walking, entering a protected area or swimming.
PVGIS typical meteorological year (2005–2020) at the reference point. Sunshine uses hourly direct irradiance of at least 120 W/m²; daylight is calculated from latitude. Both are average hours per day. Conditions vary between the coast, uplands and mountains.
Fasnia · 28.2367, -16.4409 · 441 m
| Month | Mean temperature (°C) | Sunshine (h) | Daylight (h) |
|---|---|---|---|
| Jan | 14.2 | 8.2 | 10.6 |
| Feb | 13.3 | 8.0 | 11.2 |
| Mar | 15.7 | 9.9 | 11.9 |
| Apr | 16.6 | 9.2 | 12.8 |
| May | 17.8 | 10.0 | 13.5 |
| Jun | 19.1 | 11.5 | 13.9 |
| Jul | 20.1 | 12.0 | 13.7 |
| Aug | 23.9 | 10.7 | 13.1 |
| Sep | 21.3 | 10.7 | 12.3 |
| Oct | 20.0 | 8.1 | 11.4 |
| Nov | 19.5 | 8.3 | 10.7 |
| Dec | 18.3 | 8.7 | 10.4 |